137 listings for sale in Hurontario
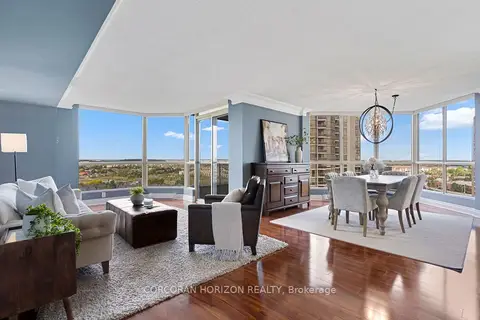
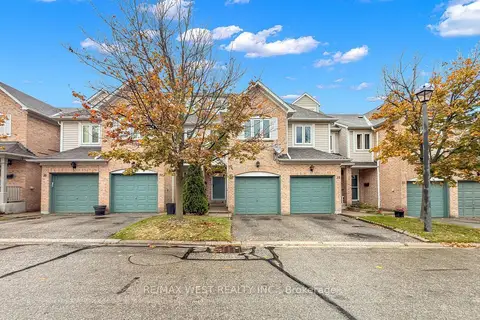
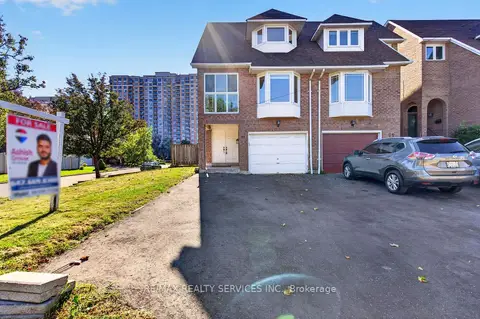
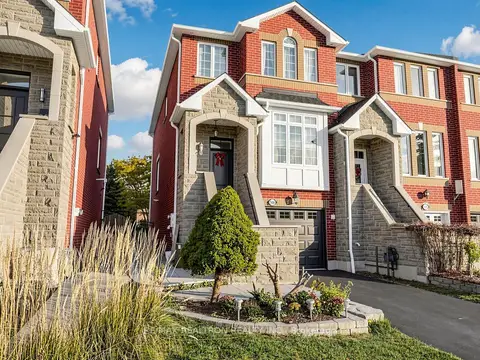
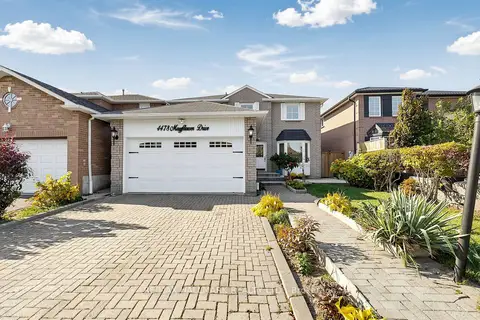
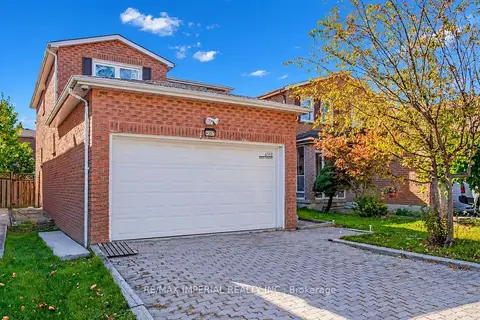
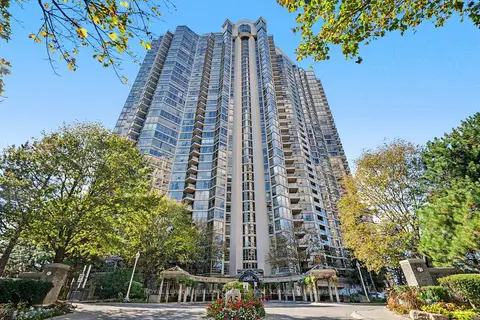
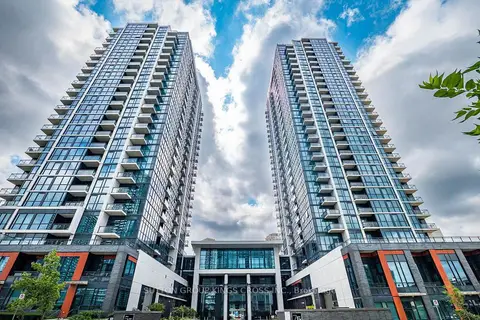
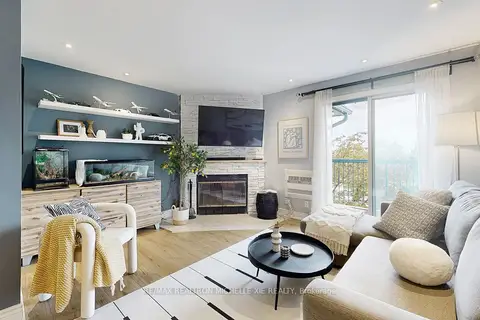
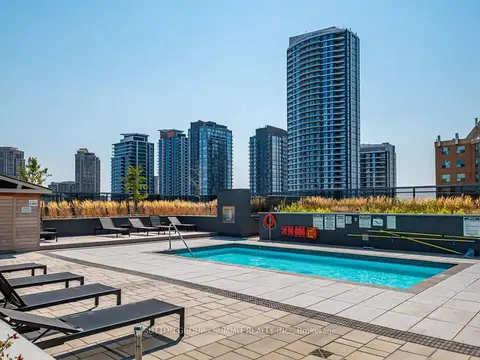
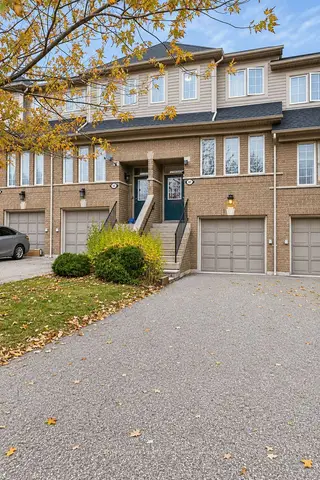
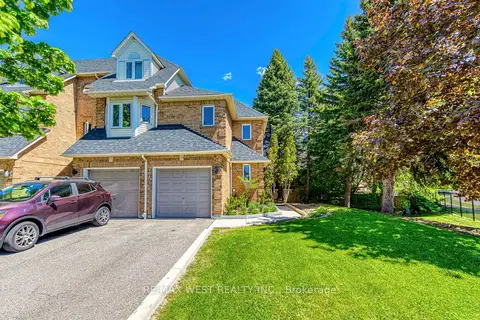
Current listings in Hurontario, Mississauga include 26 Detached from $969K–$1.7M, 5 Semi-Detached from $800K–$1.1M, 4 Freehold Townhouses from $845K–$1M, 28 Condo Townhouses from $400K–$1.4M, and 74 Condo Apartments from $385K–$1.5M.
Keep exploring
Get to know Hurontario
The numbers
Hurontario by the numbers
properties for sale in Hurontario vs Mississauga
In Hurontario, the median asking price for properties is $679.3K, 24% lower than Mississauga ($888K).
Properties that sold in October 2026 went for a median of $510 per square foot, 6% lower than Mississauga ($544).
Sales in October 2026 closed at 96% of the asking price, about the same as Mississauga (96%).
Listings have been on the market for an average of 46 days, about the same as Mississauga (51).
There are 4.1 months of inventory at the recent sales pace, fewer than Mississauga (4.7).
| Metric | Hurontario | Mississauga |
|---|---|---|
| Median Asking Price | $679.3K | $888K |
| Median Sold $/sqft | $510 | $544 |
| Sale-to-List Ratio | 96% | 96% |
| Avg. Days on Market | 46 | 51 |
| Months of Inventory | 4.1 | 4.7 |
Asking prices, days on market and inventory are current. Sold figures are for sales in October 2026.
Hurontario Real Estate Market
As of November 2026, Hurontario, Mississauga has 26 active detached homes for sale with a median list price of $1.3M, averaging 37 days on market. Inventory is low at 2.4 months of inventory, but only 56% of sellers who left the market in the last three months sold, so this is currently a balanced market.
Balanced market
2.4 months of inventory
49% of new listings sold
Supply is low, but only 56% of sellers who left the market sold.
How we call the market
Inventory is low at 2.4 months of inventory, but only 56% of sellers who left the market in the last three months sold, so this is currently a balanced market. From August to October 2026, 33 detached homes sold, 26 sellers took their home off the market without relisting and 14 came back at a lower price — a 56% sell-through. Over August to October 2026, homes sold for a median 93.9% of their first asking price, and the median sold price per square foot was down 12.1% from the same months a year earlier.
What we measure, over the last three full months
- Months of inventory: homes for sale today, divided by the average number sold per month. Fewer months means less choice for buyers.
- Sell-through: of the sellers whose listing ended, the share who actually sold. A seller who takes their home off the market and doesn’t list it again within 60 days counts as not selling. A home that comes off and goes back on (often a day later, at a lower price) counts as a price cut, not a seller giving up.
- Sold vs. first asking price: what homes sold for, compared with the price they were first listed at. We follow a home back through any relists, because a relist starts a new MLS® listing and hides the earlier, higher price.
- Sales to new listings: homes sold for every 100 that came on the market. TRREB publishes this as its SNLR. Under 40% favours buyers and over 60% favours sellers.
- Price trend: the median sold price per square foot, compared with the same three months a year earlier.
How the call is made
- Seller’s market: under 3 months of inventory, at least 70% sell-through, and homes selling for 98% or more of their first asking price, or prices up from a year ago while homes sell for at least 96% of it. We also need at least 20 sales in the three months, because a handful of sales can swing the numbers.
- Buyer’s market: over 6 months of inventory, or under 50% sell-through (more sellers giving up than selling).
- Balanced market: everything in between, including low inventory where sellers are cutting prices, relisting or pulling their homes. We say it leans toward buyers when fewer than 40% of new listings sold or inventory is 5 months or more, and toward sellers when more than 60% sold.
Based on MLS® listings from TRREB. Area totals only. We don’t show a call when fewer than 10 homes sold in those three months. Relists are matched by address, so a home relisted under a differently written address counts as taken off the market. Private sales and listings not on MLS® aren’t included. This is a general guide to the area, not an appraisal or advice about a specific home.
Based on properties for sale & sold — rentals not included. Figures are a monthly rollup covering November 1–4, 2026 (month to date), refreshed with each MLS® sync — shown as of November 4, 2026.
Property Type
Bedrooms
26
Number of homes currently for sale in this area.
$1.3M
The middle asking price among active listings -- half are listed higher, half lower.
$566
Median list price divided by square footage, for comparing across different unit sizes.
37
Average number of days active listings have been on the market.
| Metric | Current |
|---|---|
| Active listings | 26 |
| Median asking price | $1.3M |
| Average days on market | 37 |
| Months of inventory | 2.4 mo |
| Sales in October 2026 | 15 |
| Sale-to-list ratio | 95% |
| YoY median sold-price change | — |
Price trend
Median asking price against median sold price, by month.
What actually sold
15 detached homes sold in Hurontario, Mississauga in October 2026 at a median of $1.1M. Sales closed at an average of 95% of asking price.
Closed sales — the figures above describe homes still on the market.
$1.1M
The middle sold price among closed sales this period -- half sold for more, half for less.
$516
Median sold price divided by square footage, for comparing across different unit sizes.
2.4 mo
How long it would take to sell all current listings at the recent sales pace. Lower favors sellers, higher favors buyers.
—
Homes sold this period as a share of new listings -- a higher ratio signals stronger demand.
95%
Average sold price as a percentage of asking price. Above 100% means homes are selling over asking.
15 sold in October 2026 · median $1.1M · 95% of asking
Aggregate estimates from TRREB MLS® data (PropTx feed). Deemed reliable but not guaranteed, and not an appraisal. Full terms.
Free monthly email
Get Hurontario sold prices by email each month
One email when the Hurontario market report updates. No account needed, and you can unsubscribe any time.
Buildings
Hurontario Condo Buildings
Explore condos for sale in Hurontario, Mississauga. Browse building-level listings, pricing, amenities, suite sizes and market data for individual buildings in this neighbourhood.
Condo buildings in Hurontario, Mississauga.
- Canopy Towers Condos
- The Esprit Condos
- Sandalwood Townhomes
- Amber Condos
- 211 Forum Drive Condos
- 4635 Regents Terrace Townhouses
- California Condominiums
- Crystal Condos
- 50 Strathaven Drive Townhouses
- Woods End Condominiums
- Skymark West Condos
- 700 Constellation Drive Condos
The guide
Living in Hurontario
Mississauga, ON — the Hurontario corridor through central Mississauga, on the new Hazel McCallion LRT
What kind of homes are for sale in Hurontario?
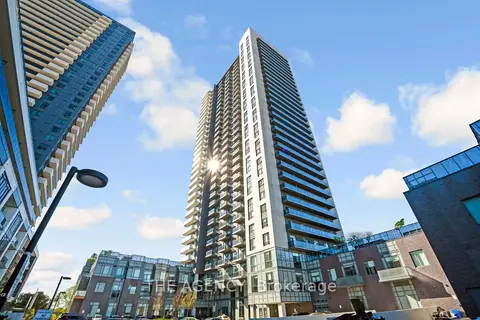
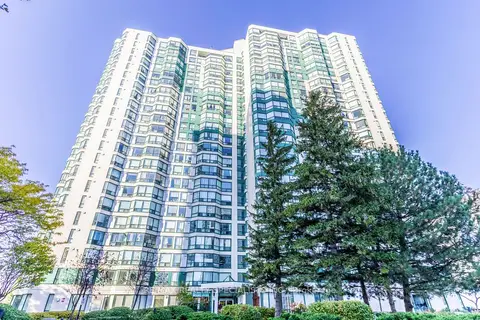
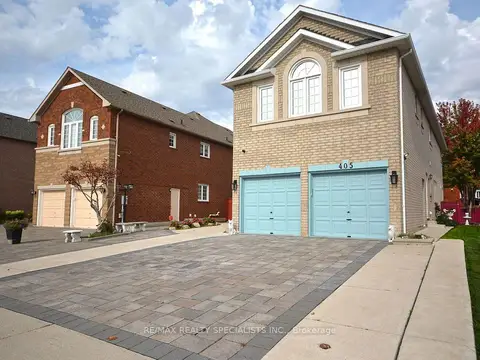
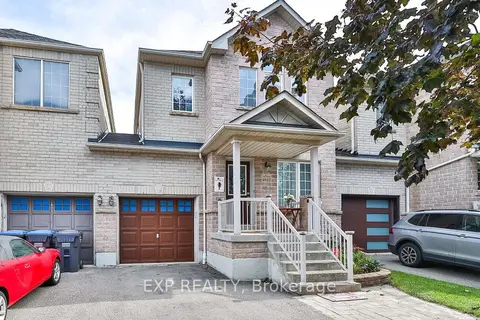
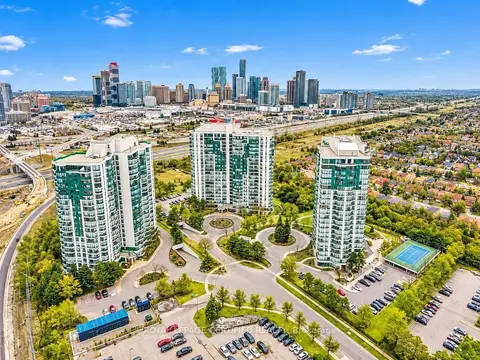
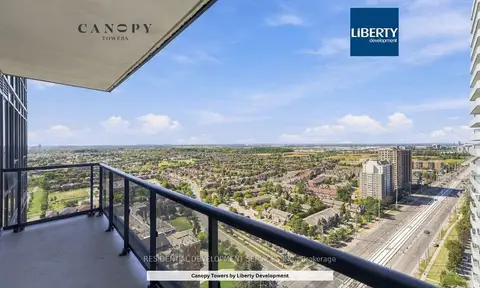
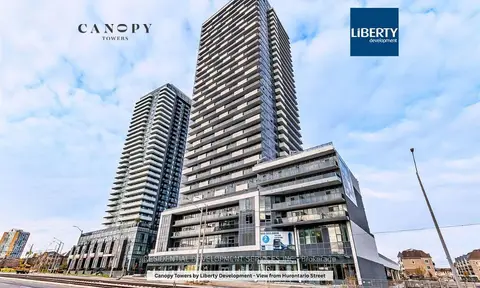
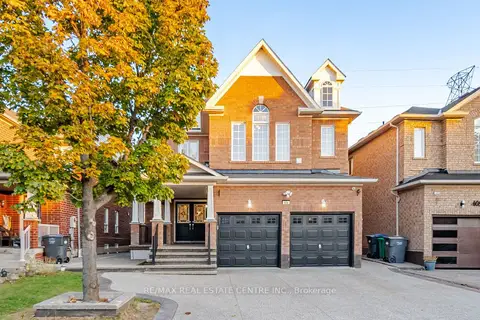
The condo towers are the most visible part of the neighbourhood, from 1990s Tridel and Belmont towers on Kingsbridge Garden Circle and Tucana Court to the new Pinnacle Uptown, Canopy Towers and Mississauga Square buildings at Eglinton. Our Hurontario & Eglinton condos page covers them in detail. Away from the towers, condo townhouse complexes are common on streets such as Bristol Road East, Regents Terrace, Apache Court and Strathaven Drive, including 4635 Regents Terrace, 80 Strathaven Drive and Pinnacle's Little Creek Townhomes. Detached and semi-detached houses, mostly from the late 1980s and 1990s, fill the residential streets. Search by type with Mississauga townhouses for sale and Mississauga homes for sale.
What is it like to live in Hurontario?
Hurontario is about convenience. Square One and the City Centre are just south, Heartland Town Centre is to the north-west, and Highways 401, 403 and 410 are all close. The Hazel McCallion Line will stop at Eglinton and Bristol once it opens, now slated for around 2028, giving residents a direct rail link south to Square One, Cooksville GO and Port Credit GO. Parks and schools are spread through the residential streets; schools come under the Peel District School Board and the Dufferin-Peel Catholic District School Board, so confirm the school for your address. Expect construction along the Hurontario corridor until the line opens.
What should buyers check?
For a townhouse complex, read the status certificate and reserve fund study, and ask what the fee covers; many complexes date from the late 1980s and 1990s and may be approaching roof and window replacements. For a house of that era, ask about the age of the roof, furnace and air conditioning. Homes right on Hurontario Street or Eglinton Avenue will have more traffic and construction noise, so visit at rush hour.
Hurontario compared, and figures
City Centre, to the south, is almost all condos. East Credit, to the west, and Rathwood, to the south-east, have more detached houses. The Hurontario market report covers every property type, and the Hurontario condo report focuses on apartments. Our home evaluation gives sellers a comparable-sales estimate.
School catchments, programs and transit schedules change — verify them for Hurontario before you buy.
Hurontario Real Estate FAQ
Where is the Hurontario neighbourhood in Mississauga?
It runs along Hurontario Street between Square One and Bristol Road, centred on the Eglinton Avenue intersection.
What kind of homes are in Hurontario?
Condo apartments in towers old and new, many condo townhouse complexes, and detached and semi-detached houses from the late 1980s and 1990s.
Will the LRT stop in Hurontario?
Yes. The Hazel McCallion Line will stop at Eglinton and Bristol, with completion slated for around 2028.
Are there townhouses for sale in Hurontario?
Yes, many. Condo townhouse complexes are common on streets such as Bristol Road East, Regents Terrace, Apache Court and Strathaven Drive.
How much do homes cost in Hurontario?
It varies widely by type. The Hurontario market reports on this site show current sold prices, updated monthly.

Miko Nalepa
Realtor® at The Condo Bar Real Estate · RECO #4737024
With 15+ years in real estate and a GTA West focus since 2016, Miko Nalepa is a Realtor® with Right At Home Realty, Brokerage, specializing in condos, townhouses, and detached homes across Mississauga, Oakville, Burlington, and Milton. The focus stays deliberately narrow -- four cities, not a Toronto-wide practice -- because that's what it takes to know individual buildings and blocks, not just neighbourhood names.
Miko Nalepa is also the creator of The Condo Bar, the data platform behind this site, tracking building-level sales history and live market reports across 450+ GTA West condo buildings so every recommendation starts with what comparable units actually closed for, not asking price.