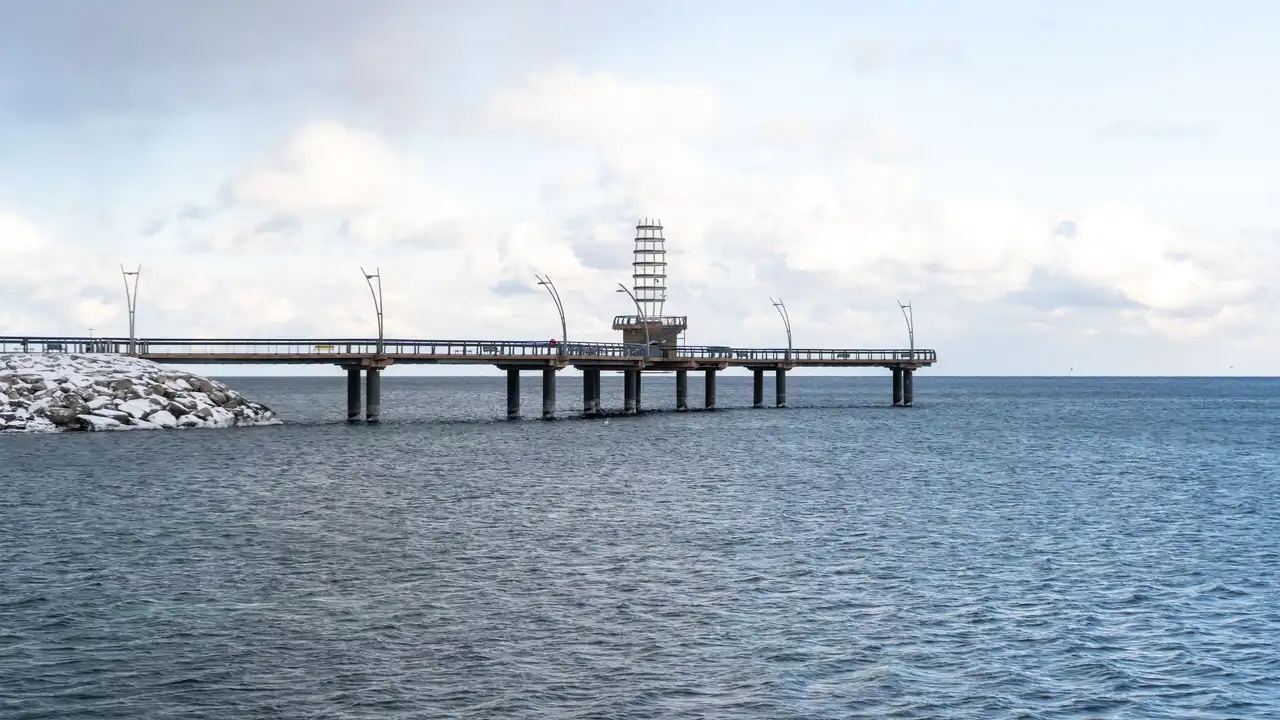
74 bungalows for sale in Burlington
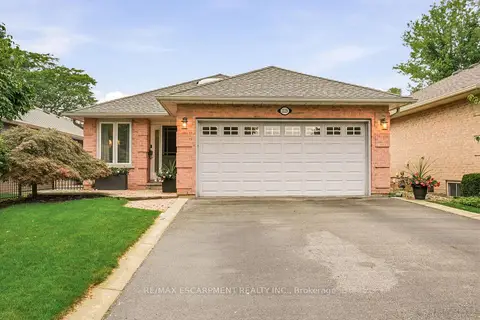
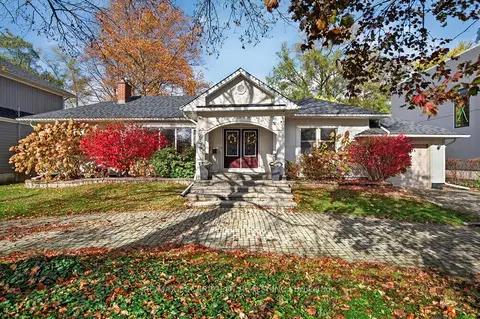
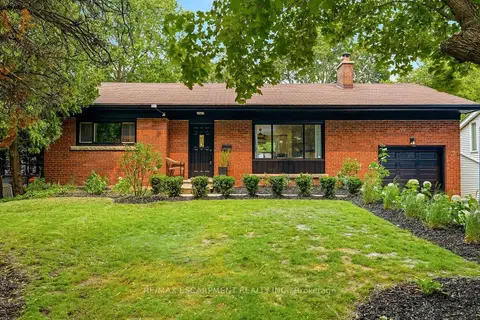
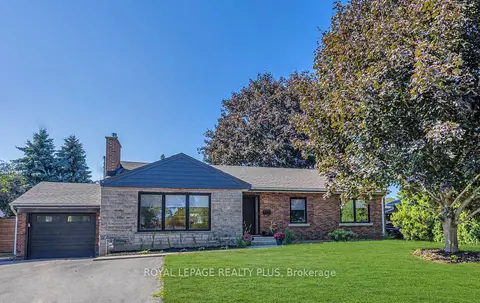
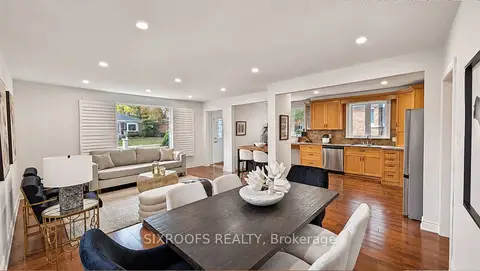
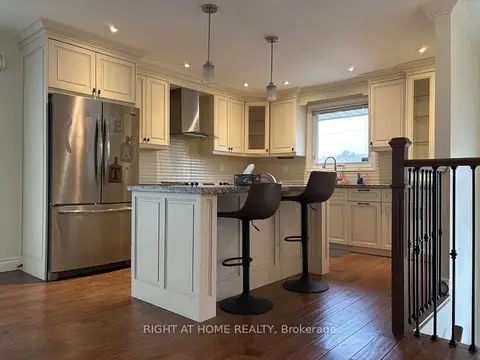
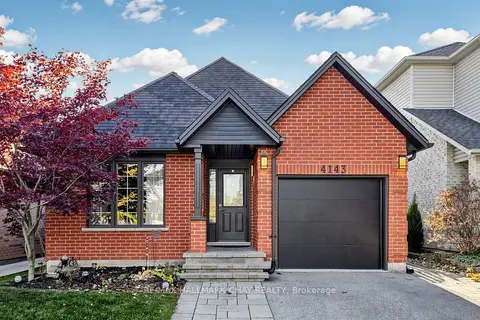
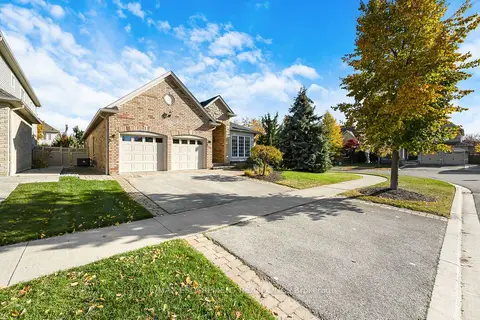
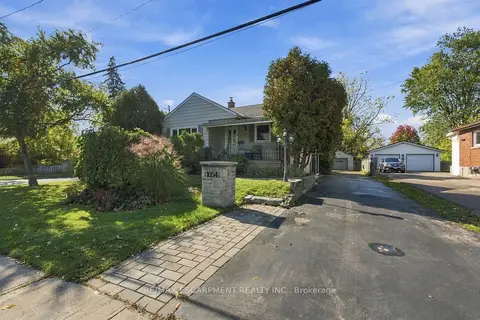
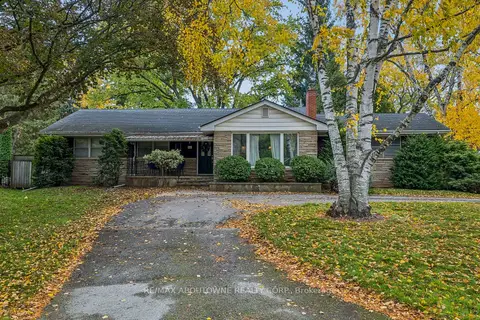
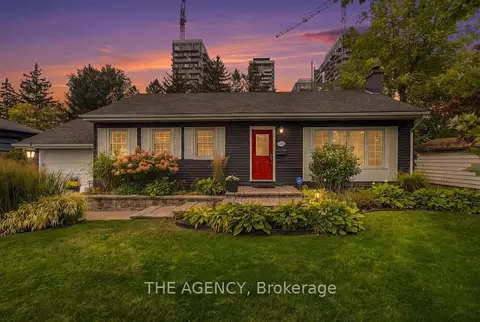
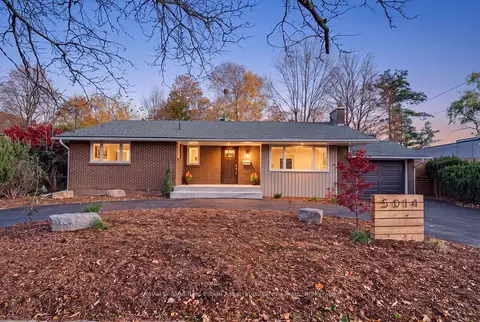
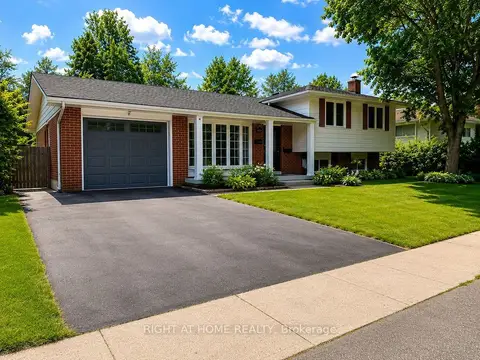
Current listings in Burlington include 2-bedroom detached homes from $699.9K–$1.2M, 3-bedroom detached homes from $699.9K–$7.5M, and 4+ bedroom detached homes from $797.9K–$3.8M.
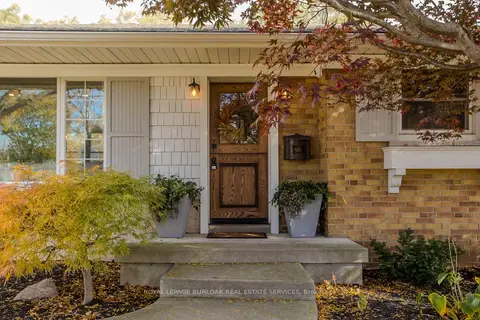
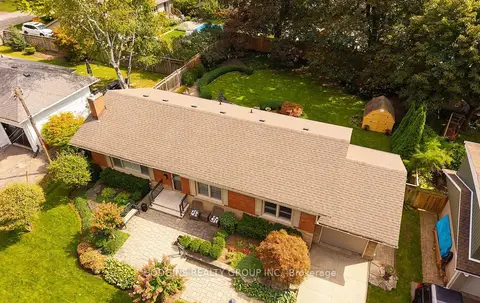
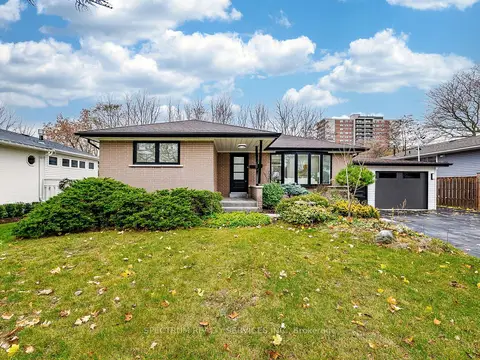

Bungalows in nearby cities
Not set on Burlington? See bungalows for sale in the cities next door.
Keep exploring
Get to know Burlington
The numbers
Burlington Home Market
As of November 2026, Burlington has 251 active detached homes for sale with a median list price of $1.4M, averaging 45 days on market. Inventory is low at 2.8 months of inventory, but homes are selling under their first asking price and prices aren't clearly rising, so this is currently a balanced market.
Based on properties for sale & sold — rentals not included. Figures are a monthly rollup covering November 1–11, 2026 (month to date), refreshed with each MLS® sync — shown as of November 11, 2026.
Bedrooms
Market condition
Balanced market
2.8 months of inventory
47% of new listings sold
Supply is low, but homes are selling under their first asking price and prices aren’t clearly rising.
How we call the market
Inventory is low at 2.8 months of inventory, but homes are selling under their first asking price and prices aren't clearly rising, so this is currently a balanced market. From August to October 2026, 270 detached homes sold, 98 sellers took their home off the market without relisting and 174 came back at a lower price — a 73% sell-through. Over August to October 2026, homes sold for a median 95.1% of their first asking price, and the median sold price per square foot was about the same as a year earlier.
What we measure, over the last three full months
- Months of inventory: homes for sale today, divided by the average number sold per month. Fewer months means less choice for buyers.
- Sell-through: of the sellers whose listing ended, the share who actually sold. A seller who takes their home off the market and doesn’t list it again within 60 days counts as not selling. A home that comes off and goes back on (often a day later, at a lower price) counts as a price cut, not a seller giving up.
- Sold vs. first asking price: what homes sold for, compared with the price they were first listed at. We follow a home back through any relists, because a relist starts a new MLS® listing and hides the earlier, higher price.
- Sales to new listings: homes sold for every 100 that came on the market. TRREB publishes this as its SNLR. Under 40% favours buyers and over 60% favours sellers.
- Price trend: the median sold price per square foot, compared with the same three months a year earlier.
How the call is made
- Seller’s market: under 3 months of inventory, at least 70% sell-through, and homes selling for 98% or more of their first asking price, or prices up from a year ago while homes sell for at least 96% of it. We also need at least 20 sales in the three months, because a handful of sales can swing the numbers.
- Buyer’s market: over 6 months of inventory, or under 50% sell-through (more sellers giving up than selling).
- Balanced market: everything in between, including low inventory where sellers are cutting prices, relisting or pulling their homes. We say it leans toward buyers when fewer than 40% of new listings sold or inventory is 5 months or more, and toward sellers when more than 60% sold.
Based on MLS® listings from TRREB. Area totals only. We don’t show a call when fewer than 10 homes sold in those three months. Relists are matched by address, so a home relisted under a differently written address counts as taken off the market. Private sales and listings not on MLS® aren’t included. This is a general guide to the area, not an appraisal or advice about a specific home.
251
Number of homes currently for sale in this area.
$1.4M
The middle asking price among active listings -- half are listed higher, half lower.
$768
Median list price divided by square footage, for comparing across different unit sizes.
45
Average number of days active listings have been on the market.
| Metric | Current |
|---|---|
| Active listings | 251 |
| Median asking price | $1.4M |
| Average days on market | 45 |
| Months of inventory | 2.8 mo |
| Metric | Current |
|---|---|
| Sales in November 2026 (month to date) | 18 |
| Sale-to-list ratio | 97% |
| YoY median sold-price change | -7.6% |
Price trend
Median asking price against median sold price, by month.
-7.6%
Median sold price this period compared to the same month last year.
What actually sold
99 detached homes sold in Burlington in October 2026 at a median of $1.2M. Sales closed at an average of 96% of asking price.
Closed sales — the figures above describe homes still on the market.
$1M
The middle sold price among closed sales this period -- half sold for more, half for less.
$743
Median sold price divided by square footage, for comparing across different unit sizes.
2.8 mo
How long it would take to sell all current listings at the recent sales pace. Lower favors sellers, higher favors buyers.
35%
Homes sold this period as a share of new listings -- a higher ratio signals stronger demand.
97%
Average sold price as a percentage of asking price. Above 100% means homes are selling over asking.
18 sold in November 2026 (month to date) · median $1M · 97% of asking
Aggregate estimates from TRREB MLS® data (PropTx feed). Deemed reliable but not guaranteed, and not an appraisal. Full terms.
Free monthly email
Get Burlington sold prices by email each month
One email when the Burlington market report updates. No account needed, and you can unsubscribe any time.
Best for
Best for...
Best for Resale Liquidity: LaSalle
LaSalle has the deepest current market surveyed -- 45 active listings and 18 closed sales in the trailing 3 months -- meaning less risk of an illiquid resale.
Best for: Investors who want an exit option -- a deep resale market when it is time to sell.
Best for Demand Momentum: Appleby
Appleby is absorbing new listings fastest of any neighbourhood surveyed -- a 100% sales-to-new-listings ratio, a sign of demand outrunning current supply.
Best for: Buyers who want to move before rising demand pushes prices further.
Best for a Fast-Moving Market: Mountainside
Mountainside has the tightest inventory surveyed -- 0.9 months of supply at the current sales pace, with a $899,000 median list price.
Best for: Buyers ready to act quickly when the right listing comes up.
Best for Buyer Negotiating Leverage: LaSalle
LaSalle carries the loosest inventory surveyed -- 7.5 months of supply -- meaningfully more choice for a buyer than current sales pace is absorbing.
Best for: Buyers who want room to negotiate and more listings to compare before committing.
Best for a Premium, Patient Hold: Tyandaga
Tyandaga carries the highest median list price surveyed, $2,050,000, with a longer average time on market (69 days) -- a patient, premium submarket rather than a quick turnover.
Best for: Long-term holders comfortable paying a premium for a slower-moving, higher-end submarket.
Best for Cash Flow: Alton
Alton has the highest gross rent yield surveyed -- 4.2% (median asking rent against median list price, before carrying costs).
Best for: Investors prioritizing rental income over price appreciation.
Neighbourhoods
Browse Burlington Homes by Neighbourhood
downtown Burlington along Brant Street, steps from the waterfront and Spencer Smith Park
Roseland9 Bungalow Listings For Salea prestigious, tree-lined community in south Burlington near the lake
Shoreacres7 Bungalow Listings For Salea prestigious lakeside community in southeast Burlington
Bayview6 Bungalow Listings For Salean Aldershot waterfront pocket near LaSalle Park and Burlington Bay
Grindstone5 Bungalow Listings For SaleAppleby4 Bungalow Listings For Salea southeast-Burlington community near the lake and Appleby GO
Rose2 Bungalow Listings For Salethe Millcroft golf-course community in north Burlington
Brant Hills1 Bungalow Listing For Salea family-oriented north-Burlington community off Guelph Line
The guide
Buying a Bungalow in Burlington
Where are the bungalows in Burlington?
Burlington has a larger share of bungalows than most GTA West cities, and they are spread across several areas. LaSalle, in Aldershot near Hamilton Harbour, and Shoreacres, in the east end near the lake, have quiet streets of postwar bungalows. Roseland and Rose mix bungalows with larger older homes on mature lots. Closer to downtown, Brant has them too. North of the QEW, Tyandaga has sprawling bungalows near the golf course. Newer areas like Alton were built mostly with two-storey homes and townhouses.
What should I know about a rural Burlington bungalow?
North of the city, rural Burlington has bungalows on acre-size lots and larger. These homes usually run on a private well and a septic system instead of city water and sewer. Make your offer conditional on a septic inspection and a water test. Halton Region can help you test well water for bacteria at no cost. Much of this area is inside the Niagara Escarpment Plan, so building an addition, a garage or a pool can need a permit from the Niagara Escarpment Commission as well as the city. Check Conservation Halton’s mapping too, since creeks and slopes are common here. Heating may be oil or propane rather than natural gas, so ask about fuel costs.
Is a Burlington bungalow a good fit for downsizing?
Burlington is a popular place to downsize, and bungalows are a big part of why. You get one-floor living, a yard and a garage, with no condo fee or board. Walk each home with the future in mind: steps at the entrances, a main-floor laundry, and a bathroom with a walk-in shower or room to add one. Many south Burlington bungalows are close to the lakefront trails and to shops along Lakeshore Road and Plains Road. If you would rather give up the yard work, compare Burlington condos or condo townhouses, where the corporation handles outdoor upkeep.
What should I check before buying an older Burlington bungalow?
Many of Burlington’s bungalows were built fifty or more years ago. A good inspection should look at the wiring and electrical panel, the roof, the furnace, and any signs of water in the basement. Ask about past oil tanks and look for removal records. In the lakeside neighbourhoods, check the lot grading and the sump pump, since heavy rain can test older basements. Make sure past additions and finished basements have permits. Our home inspection guide explains what to expect, and our closing costs guide lists what you’ll pay on closing day.
How do I read bungalow prices in Burlington?
The live listing count and price range at the top of this page update with every MLS® sync. The Burlington detached home market report tracks sold prices and how long homes take to sell. Bungalow prices in Burlington vary widely by area. A small bungalow near the lake can cost more than a larger one farther north, and rural homes are priced on their land and setting. Compare homes in the same neighbourhood, and look at lot size alongside the house.
Burlington Bungalow FAQ
Which Burlington neighbourhoods have the most bungalows?
LaSalle in Aldershot, Shoreacres in the east end, Roseland and Rose in the south, Brant near downtown, and Tyandaga north of the QEW. Rural north Burlington has bungalows on large country lots.
Do rural Burlington bungalows have city water?
Most don’t. Rural homes usually use a private well and a septic system. Make your offer conditional on a septic inspection and a well water test.
Do I need a special permit to add on to a rural Burlington home?
Often. Much of rural Burlington is in the Niagara Escarpment Plan area, where additions, garages and pools can need a Niagara Escarpment Commission permit in addition to the city’s building permit.
What is a bungaloft?
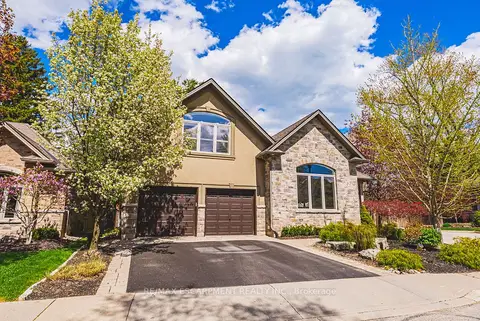
A bungaloft is a bungalow with a loft or extra bedroom above part of the main floor. You keep the main bedroom on the ground floor, with space upstairs for guests or an office.
Is a bungalow or a condo better for downsizing in Burlington?
A bungalow gives you one floor with a yard and no monthly fee. A condo or condo townhouse takes care of outdoor upkeep for a monthly fee. It comes down to how much maintenance you still want to do.

Miko Nalepa
Realtor® at The Condo Bar Real Estate · RECO #4737024
With 15+ years in real estate and a GTA West focus since 2016, Miko Nalepa is a Realtor® with Right At Home Realty, Brokerage, specializing in condos, townhouses, and detached homes across Mississauga, Oakville, Burlington, and Milton. The focus stays deliberately narrow -- four cities, not a Toronto-wide practice -- because that's what it takes to know individual buildings and blocks, not just neighbourhood names.
Miko Nalepa is also the creator of The Condo Bar, the data platform behind this site, tracking building-level sales history and live market reports across 450+ GTA West condo buildings so every recommendation starts with what comparable units actually closed for, not asking price.