36 listings for sale in Shoreacres
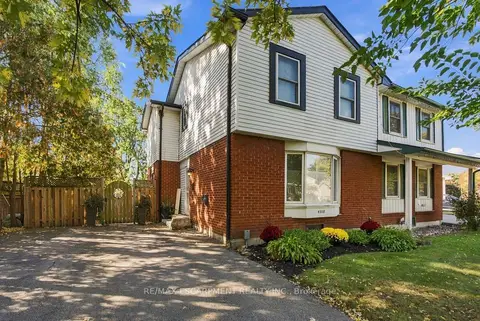
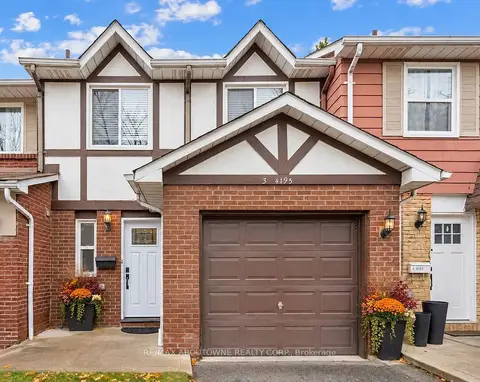
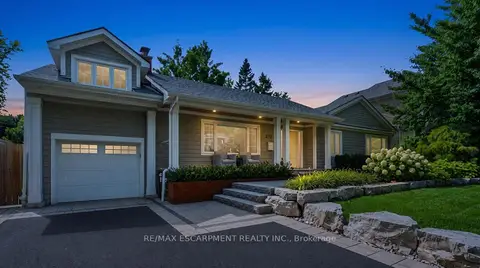
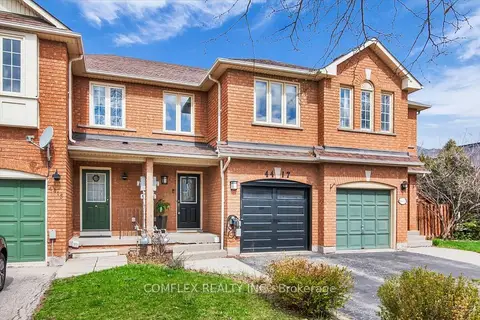
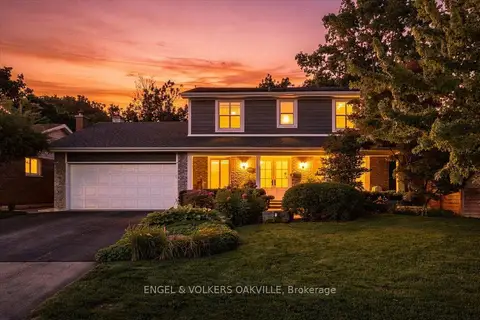
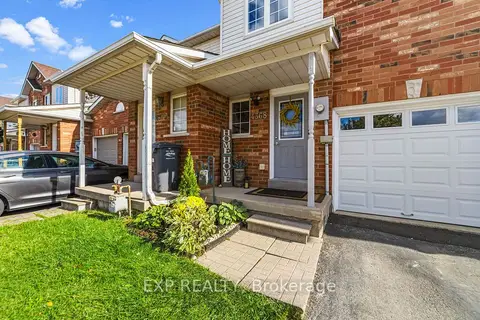
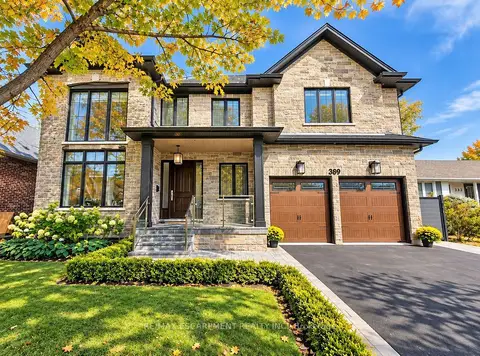
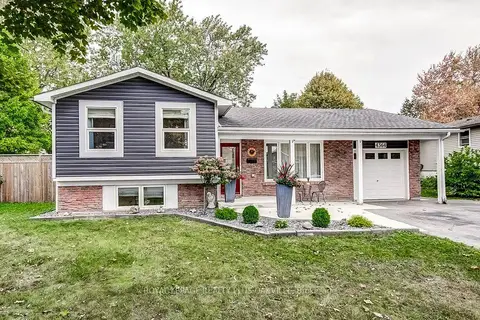
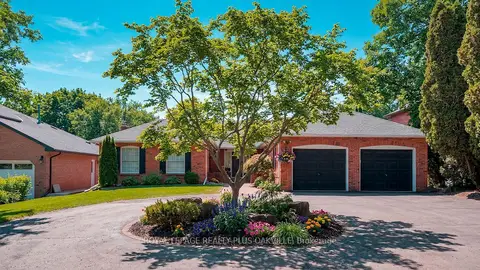
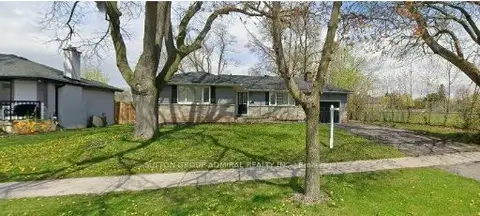
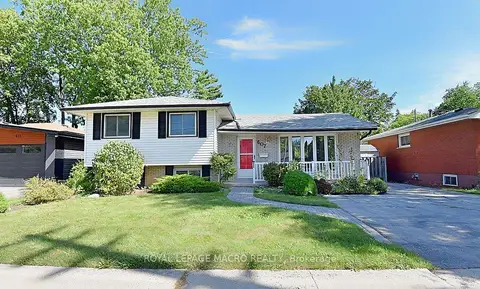
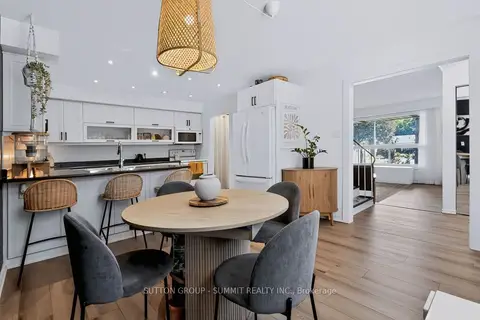
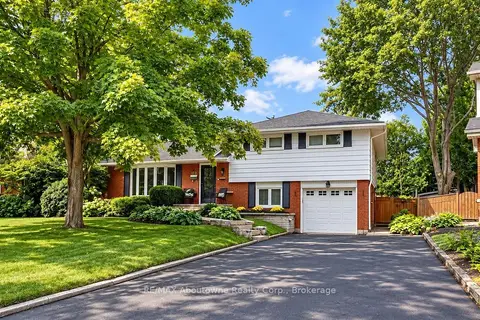
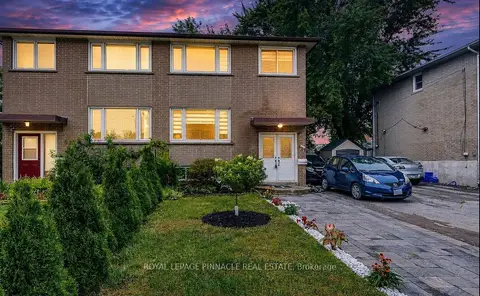
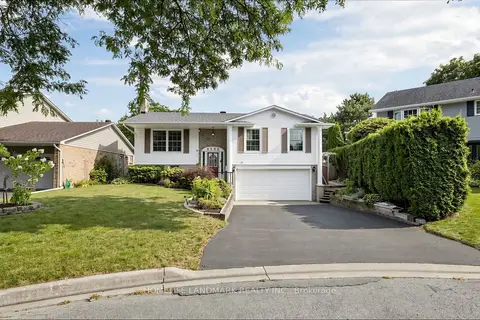
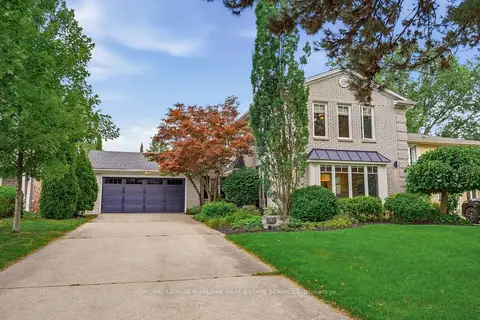
Current listings in Shoreacres, Burlington include 27 Detached from $789K–$15M, 3 Semi-Detached from $749.9K–$880K, 2 Freehold Townhouses from $839.9K–$888K, 3 Condo Townhouses from $649.5K–$749K, and 1 Condo Apartment from $775K.

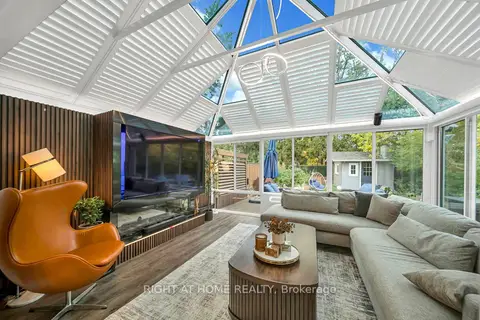
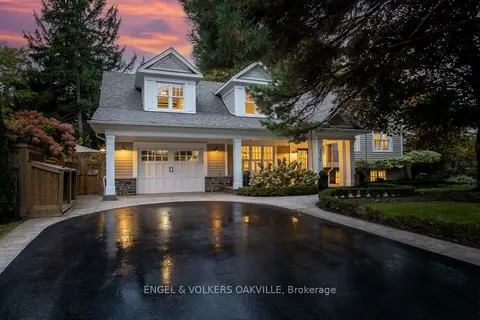
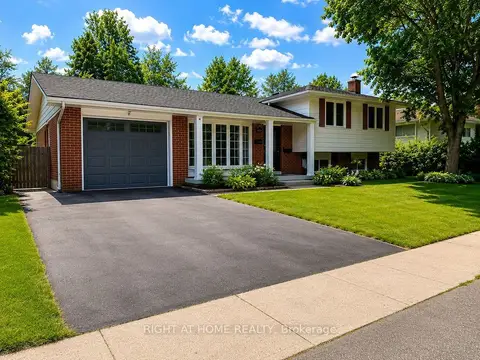
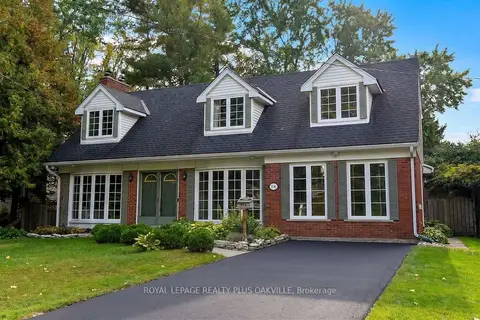
Keep exploring
Get to know Shoreacres
The numbers
Shoreacres by the numbers
properties for sale in Shoreacres vs Burlington
In Shoreacres, the median asking price for properties is $1.4M, 52% higher than Burlington ($919.5K).
Properties that sold in October 2026 went for a median of $782 per square foot, 33% higher than Burlington ($589).
Sales in October 2026 closed at 96% of the asking price, about the same as Burlington (97%).
Listings have been on the market for an average of 49 days, about the same as Burlington (46).
There are 3.4 months of inventory at the recent sales pace, more than Burlington (3.0).
| Metric | Shoreacres | Burlington |
|---|---|---|
| Median Asking Price | $1.4M | $919.5K |
| Median Sold $/sqft | $782 | $589 |
| Sale-to-List Ratio | 96% | 97% |
| Avg. Days on Market | 49 | 46 |
| Months of Inventory | 3.4 | 3.0 |
Asking prices, days on market and inventory are current. Sold figures are for sales in October 2026.
Shoreacres Real Estate Market
As of November 2026, Shoreacres, Burlington has 28 active detached homes for sale with a median list price of $1.7M, averaging 53 days on market. With 3.4 months of inventory at the recent three-month sales pace, this is currently a balanced market that leans toward buyers. Only 37 homes sold for every 100 new listings over the last three months, which tips it toward buyers.
Balanced market
Leaning toward buyers
3.4 months of inventory
37% of new listings sold
How we call the market
With 3.4 months of inventory at the recent three-month sales pace, this is currently a balanced market that leans toward buyers. Only 37 homes sold for every 100 new listings over the last three months, which tips it toward buyers. From August to October 2026, 25 detached homes sold, 14 sellers took their home off the market without relisting and 27 came back at a lower price — a 64% sell-through. Over August to October 2026, homes sold for a median 94.9% of their first asking price, and the median sold price per square foot was up 6.5% from the same months a year earlier.
What we measure, over the last three full months
- Months of inventory: homes for sale today, divided by the average number sold per month. Fewer months means less choice for buyers.
- Sell-through: of the sellers whose listing ended, the share who actually sold. A seller who takes their home off the market and doesn’t list it again within 60 days counts as not selling. A home that comes off and goes back on (often a day later, at a lower price) counts as a price cut, not a seller giving up.
- Sold vs. first asking price: what homes sold for, compared with the price they were first listed at. We follow a home back through any relists, because a relist starts a new MLS® listing and hides the earlier, higher price.
- Sales to new listings: homes sold for every 100 that came on the market. TRREB publishes this as its SNLR. Under 40% favours buyers and over 60% favours sellers.
- Price trend: the median sold price per square foot, compared with the same three months a year earlier.
How the call is made
- Seller’s market: under 3 months of inventory, at least 70% sell-through, and homes selling for 98% or more of their first asking price, or prices up from a year ago while homes sell for at least 96% of it. We also need at least 20 sales in the three months, because a handful of sales can swing the numbers.
- Buyer’s market: over 6 months of inventory, or under 50% sell-through (more sellers giving up than selling).
- Balanced market: everything in between, including low inventory where sellers are cutting prices, relisting or pulling their homes. We say it leans toward buyers when fewer than 40% of new listings sold or inventory is 5 months or more, and toward sellers when more than 60% sold.
Based on MLS® listings from TRREB. Area totals only. We don’t show a call when fewer than 10 homes sold in those three months. Relists are matched by address, so a home relisted under a differently written address counts as taken off the market. Private sales and listings not on MLS® aren’t included. This is a general guide to the area, not an appraisal or advice about a specific home.
Based on properties for sale & sold — rentals not included. Figures are a monthly rollup covering November 1–4, 2026 (month to date), refreshed with each MLS® sync — shown as of November 4, 2026.
Property Type
Bedrooms
28
Number of homes currently for sale in this area.
$1.7M
The middle asking price among active listings -- half are listed higher, half lower.
$938
Median list price divided by square footage, for comparing across different unit sizes.
53
Average number of days active listings have been on the market.
| Metric | Current |
|---|---|
| Active listings | 28 |
| Median asking price | $1.7M |
| Average days on market | 53 |
| Months of inventory | 3.4 mo |
| Sales in October 2026 | 14 |
| Sale-to-list ratio | 96% |
| YoY median sold-price change | — |
Price trend
Median asking price against median sold price, by month.
What actually sold
14 detached homes sold in Shoreacres, Burlington in October 2026 at a median of $1.4M. Sales closed at an average of 96% of asking price.
Closed sales — the figures above describe homes still on the market.
$1.4M
The middle sold price among closed sales this period -- half sold for more, half for less.
$820
Median sold price divided by square footage, for comparing across different unit sizes.
3.4 mo
How long it would take to sell all current listings at the recent sales pace. Lower favors sellers, higher favors buyers.
0%
Homes sold this period as a share of new listings -- a higher ratio signals stronger demand.
96%
Average sold price as a percentage of asking price. Above 100% means homes are selling over asking.
14 sold in October 2026 · median $1.4M · 96% of asking
Aggregate estimates from TRREB MLS® data (PropTx feed). Deemed reliable but not guaranteed, and not an appraisal. Full terms.
Free monthly email
Get Shoreacres sold prices by email each month
One email when the Shoreacres market report updates. No account needed, and you can unsubscribe any time.
Buildings
Shoreacres Condo Buildings
Explore condos for sale in Shoreacres, Burlington. Browse building-level listings, pricing, amenities, suite sizes and market data for individual buildings in this neighbourhood.
The guide
Living in Shoreacres
Burlington, ON — a prestigious lakeside community in southeast Burlington
What kind of homes are for sale in Shoreacres?
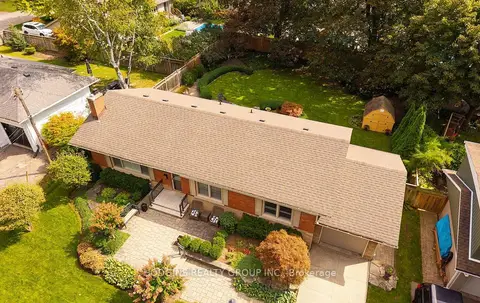
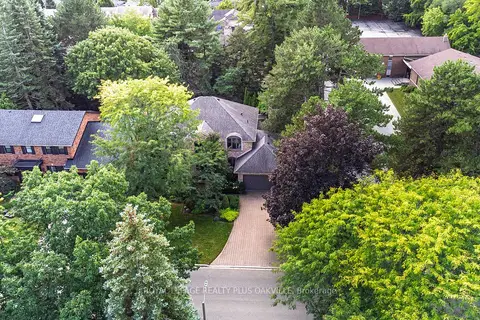
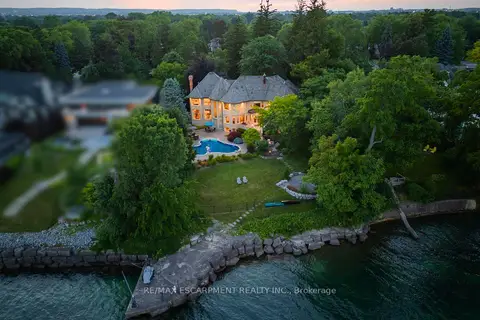
Shoreacres is a neighbourhood of detached houses, and it has two distinct parts. Close to the lake, along Lakeshore Road and the streets just north of it, lots are larger and often deeply treed. Some are waterfront, and many original houses have been replaced with custom homes. Further north, the streets filled in from the 1950s through the 1970s with bungalows, back-splits and two-storey homes on typical suburban lots, many of them now renovated. Semi-detached houses and townhouses are uncommon; the Liv Towns complex on Palermo Common is one of the few attached options. If you want a lower-maintenance home nearby, compare Burlington townhouses and Burlington condos.
What should buyers know about lakeside properties?
A lakefront or near-lake lot brings specific checks. Shoreline properties can fall within Conservation Halton's regulated area, which governs shoreline protection, additions and some landscaping, so look up the address and ask the seller about any past shoreline work and permits. Older break walls and retaining structures are expensive to repair, so have them assessed. Because many buyers plan to renovate or rebuild on these lots, check the zoning, any heritage status and recent Committee of Adjustment decisions nearby. On any older house, look closely at the electrical service, plumbing, roof and foundation, and get an insurance quote before you firm up your offer.
What is it like to live in Shoreacres?
Shoreacres is quiet and residential, with the lake as its centrepiece. Paletta Lakefront Park, about fourteen acres of City of Burlington waterfront parkland around a heritage-designated mansion built in 1929, is within the neighbourhood, and the Waterfront Trail runs along the shore. Everyday shopping is at the plazas on Appleby Line and New Street, including Appleby Village, and downtown Burlington's restaurants and waterfront are a short drive west. Schools come under the Halton District School Board and the Halton Catholic District School Board. Pineland Public School is inside the area, and John T. Tuck Public School and Nelson High School are close by; confirm the school for any address with the board.
How is the commute from Shoreacres?
Appleby GO, on the Lakeshore West line with all-day, two-way service to Union Station, is just north-east of the neighbourhood, a short drive or bike ride from most streets. The QEW and Highway 403 are a few minutes north, and Lakeshore Road offers a slower, scenic route toward Oakville. Burlington Transit buses run along the main roads, but most households drive for daily errands.
How does Shoreacres compare with other Burlington neighbourhoods?
Buyers weighing Shoreacres usually compare it with Roseland, to the west, which is similar in character, with larger lots and an established tree canopy, and with Appleby, to the east and north, which has more varied housing, including townhouses and some condos. Downtown Burlington offers walkability and condo living, while Shoreacres trades that for quieter streets close to the lake. For the whole city, see Burlington homes for sale.
How do I buy or sell in Shoreacres?
The Shoreacres market report is refreshed monthly with sold prices, days on market and inventory. Sale prices in Shoreacres range widely, since a lakefront estate and an original bungalow a few streets north are very different properties, so compare like with like on lot size, location and condition. If you're selling, our home evaluation gives a comparable-sales estimate. Burlington has no municipal land transfer tax, so buyers pay Ontario's land transfer tax only; our land transfer tax calculator gives the figure. I'm a Realtor® who works across Burlington and Halton, and I'm glad to go through listings with you, no pressure.
School catchments, programs and transit schedules change — verify them for Shoreacres before you buy.
Shoreacres Real Estate FAQ
Where is Shoreacres in Burlington?
Shoreacres is in south-east Burlington, roughly between Walkers Line and Appleby Line, running from Lake Ontario north toward Fairview Street.
What kind of homes are in Shoreacres?
Almost all detached houses: larger lakeside and near-lake lots along Lakeshore Road, and 1950s-70s bungalows, back-splits and two-storey homes further north. Townhouses and condos are rare.
Is there a park on the lake in Shoreacres?
Yes. Paletta Lakefront Park, a City of Burlington waterfront park around a heritage mansion built in 1929, is in Shoreacres, and the Waterfront Trail runs along the shore.
What GO station is closest to Shoreacres?
Appleby GO on the Lakeshore West line, just north-east of the neighbourhood, with all-day, two-way service to Union Station.
What schools are near Shoreacres?
Pineland Public School is within the area, and John T. Tuck Public School and Nelson High School are nearby. Confirm the school for any address with the Halton District or Halton Catholic board.
What should I check before buying a lakefront home in Shoreacres?
Check whether the lot is in Conservation Halton’s regulated area, the condition of any break wall or shoreline protection, and the zoning if you plan to rebuild. Get an insurance quote early.
How much do homes cost in Shoreacres?
Prices range widely between lakefront estates and original houses further north. The Shoreacres market report on this site shows current sold prices, updated monthly.
Should I buy in Shoreacres or Roseland?
Both offer larger lots and mature trees. Roseland is closer to downtown Burlington, while Shoreacres is further east near Appleby GO. Get in touch and I’ll compare specific houses, no pressure.

Miko Nalepa
Realtor® at The Condo Bar Real Estate · RECO #4737024
With 15+ years in real estate and a GTA West focus since 2016, Miko Nalepa is a Realtor® with Right At Home Realty, Brokerage, specializing in condos, townhouses, and detached homes across Mississauga, Oakville, Burlington, and Milton. The focus stays deliberately narrow -- four cities, not a Toronto-wide practice -- because that's what it takes to know individual buildings and blocks, not just neighbourhood names.
Miko Nalepa is also the creator of The Condo Bar, the data platform behind this site, tracking building-level sales history and live market reports across 450+ GTA West condo buildings so every recommendation starts with what comparable units actually closed for, not asking price.