103 listings for sale in Brant
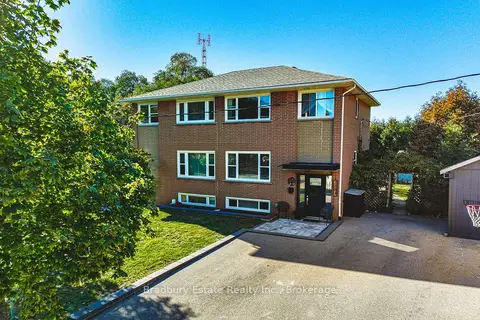
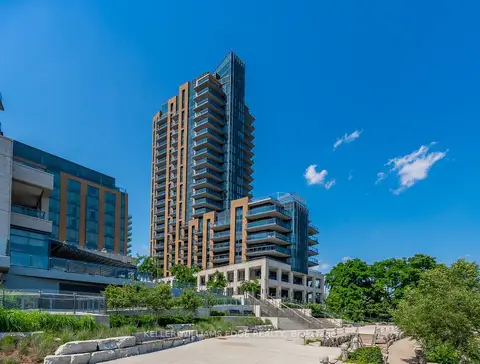
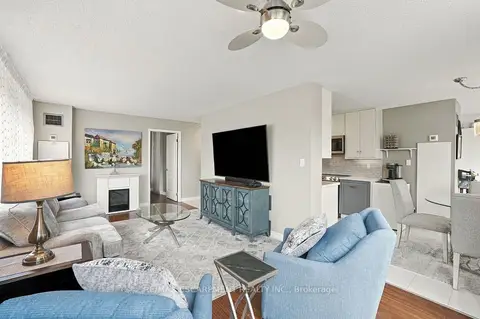
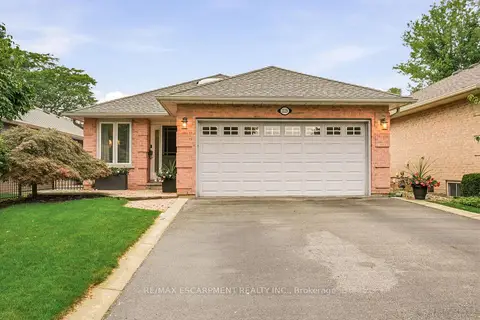
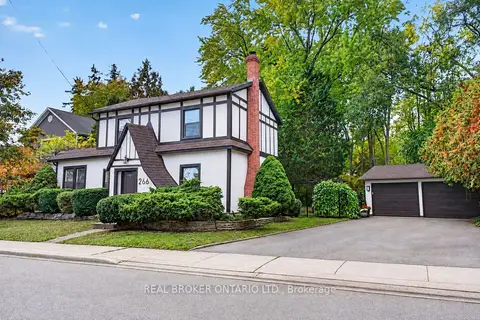
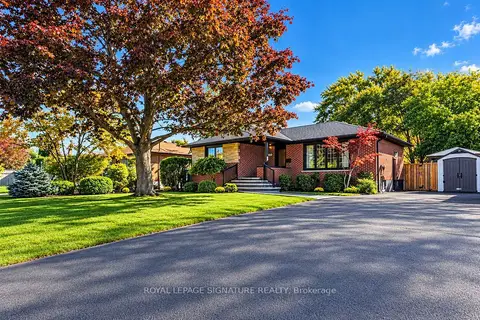
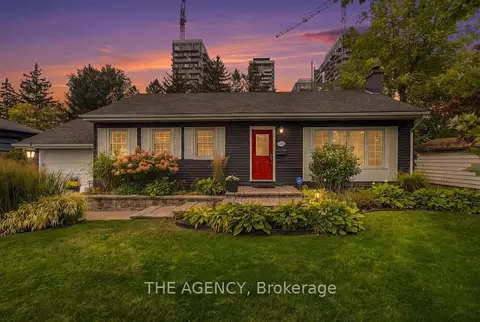
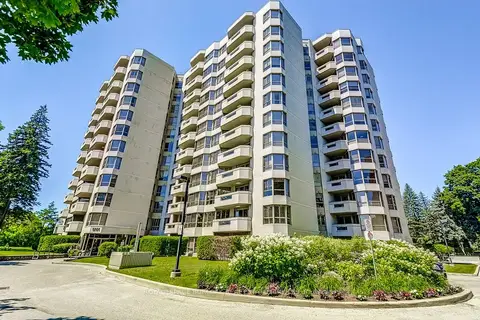
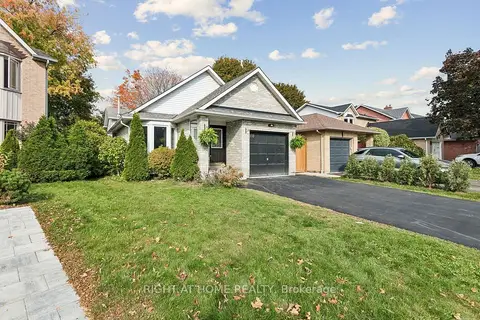
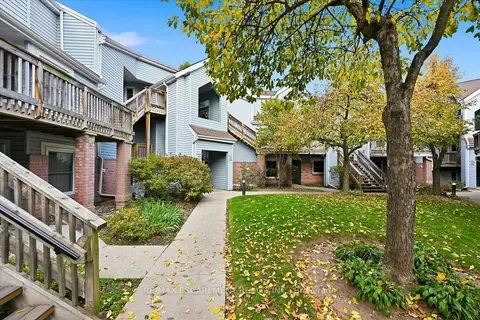
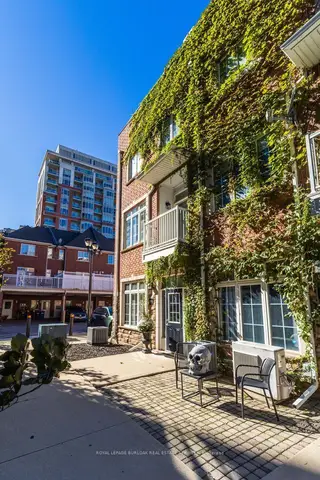
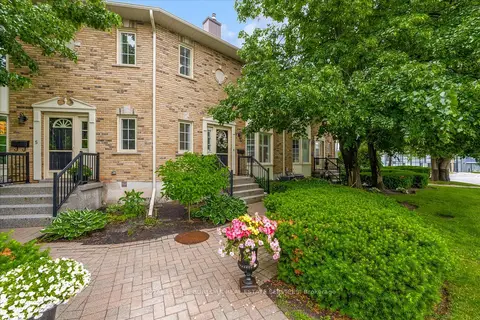
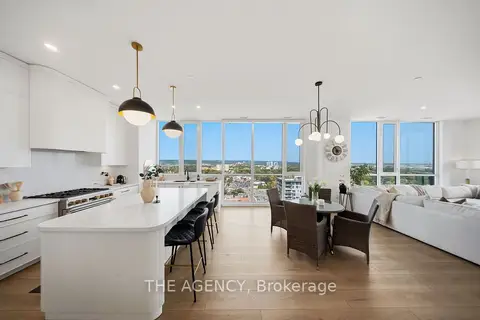
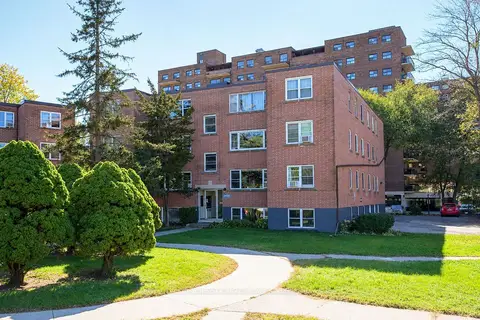
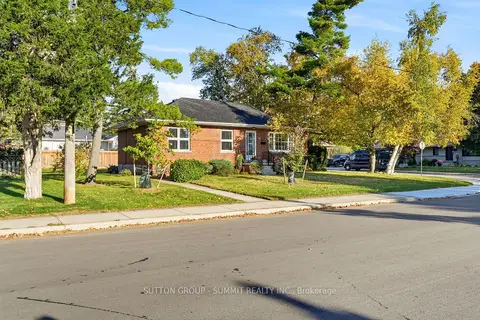
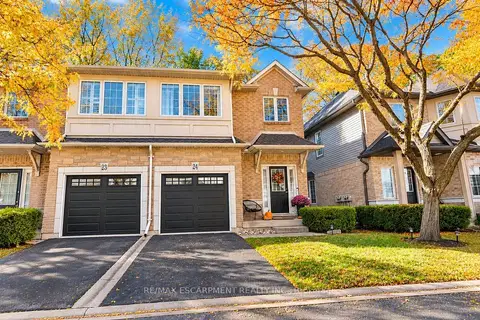
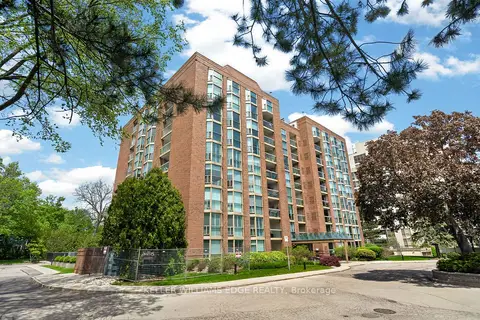
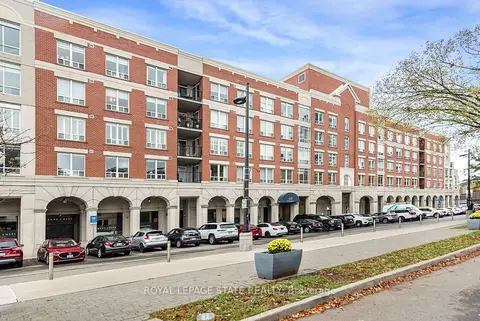
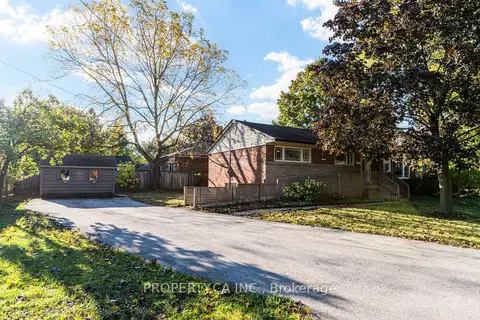
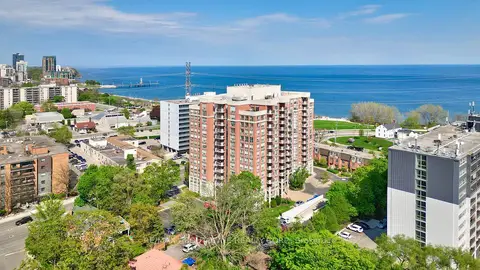
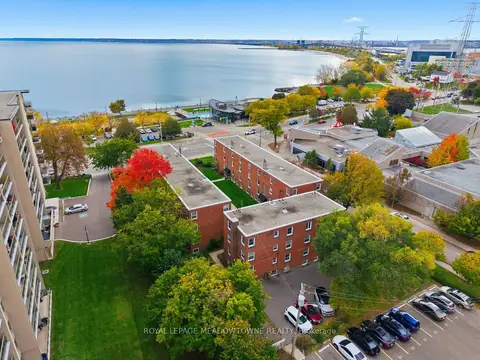
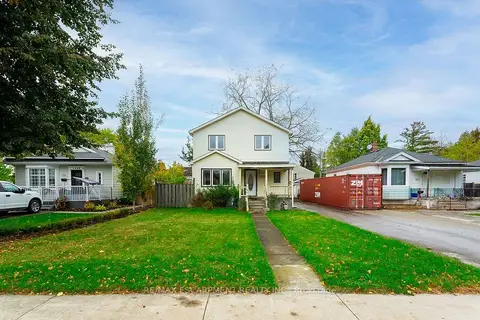
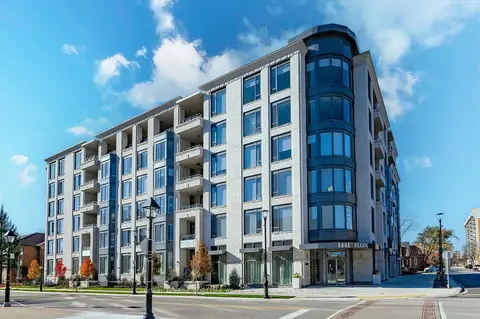
Current listings in Brant, Burlington include 29 Detached from $729K–$2.9M, 3 Semi-Detached from $699.9K–$999.9K, 5 Freehold Townhouses from $889.9K–$1.7M, 11 Condo Townhouses from $509.9K–$1.6M, and 55 Condo Apartments from $339.9K–$2M.
Keep exploring
Get to know Brant
The numbers
Brant by the numbers
properties for sale in Brant vs Burlington
In Brant, the median asking price for properties is $899.9K, about the same as Burlington ($919.5K).
Properties that sold in October 2026 went for a median of $574 per square foot, about the same as Burlington ($589).
Sales in October 2026 closed at 97% of the asking price, about the same as Burlington (97%).
Listings have been on the market for an average of 59 days, longer than Burlington (46).
There are 3.6 months of inventory at the recent sales pace, more than Burlington (3.0).
| Metric | Brant | Burlington |
|---|---|---|
| Median Asking Price | $899.9K | $919.5K |
| Median Sold $/sqft | $574 | $589 |
| Sale-to-List Ratio | 97% | 97% |
| Avg. Days on Market | 59 | 46 |
| Months of Inventory | 3.6 | 3.0 |
Asking prices, days on market and inventory are current. Sold figures are for sales in October 2026.
Brant Real Estate Market
As of November 2026, Brant, Burlington has 29 active detached homes for sale with a median list price of $1.4M, averaging 54 days on market. Inventory is low at 2.5 months of inventory, but homes are selling under their first asking price and prices aren't clearly rising, so this is currently a balanced market.
Balanced market
Leaning toward sellers
2.5 months of inventory
64% of new listings sold
Supply is low, but homes are selling under their first asking price and prices aren’t clearly rising.
How we call the market
Inventory is low at 2.5 months of inventory, but homes are selling under their first asking price and prices aren't clearly rising, so this is currently a balanced market. From August to October 2026, 35 detached homes sold, 9 sellers took their home off the market without relisting and 11 came back at a lower price — a 80% sell-through. Over August to October 2026, homes sold for a median 94.6% of their first asking price, and the median sold price per square foot was up 9.1% from the same months a year earlier.
What we measure, over the last three full months
- Months of inventory: homes for sale today, divided by the average number sold per month. Fewer months means less choice for buyers.
- Sell-through: of the sellers whose listing ended, the share who actually sold. A seller who takes their home off the market and doesn’t list it again within 60 days counts as not selling. A home that comes off and goes back on (often a day later, at a lower price) counts as a price cut, not a seller giving up.
- Sold vs. first asking price: what homes sold for, compared with the price they were first listed at. We follow a home back through any relists, because a relist starts a new MLS® listing and hides the earlier, higher price.
- Sales to new listings: homes sold for every 100 that came on the market. TRREB publishes this as its SNLR. Under 40% favours buyers and over 60% favours sellers.
- Price trend: the median sold price per square foot, compared with the same three months a year earlier.
How the call is made
- Seller’s market: under 3 months of inventory, at least 70% sell-through, and homes selling for 98% or more of their first asking price, or prices up from a year ago while homes sell for at least 96% of it. We also need at least 20 sales in the three months, because a handful of sales can swing the numbers.
- Buyer’s market: over 6 months of inventory, or under 50% sell-through (more sellers giving up than selling).
- Balanced market: everything in between, including low inventory where sellers are cutting prices, relisting or pulling their homes. We say it leans toward buyers when fewer than 40% of new listings sold or inventory is 5 months or more, and toward sellers when more than 60% sold.
Based on MLS® listings from TRREB. Area totals only. We don’t show a call when fewer than 10 homes sold in those three months. Relists are matched by address, so a home relisted under a differently written address counts as taken off the market. Private sales and listings not on MLS® aren’t included. This is a general guide to the area, not an appraisal or advice about a specific home.
Based on properties for sale & sold — rentals not included. Figures are a monthly rollup covering November 1–4, 2026 (month to date), refreshed with each MLS® sync — shown as of November 4, 2026.
Property Type
Bedrooms
29
Number of homes currently for sale in this area.
$1.4M
The middle asking price among active listings -- half are listed higher, half lower.
$846
Median list price divided by square footage, for comparing across different unit sizes.
54
Average number of days active listings have been on the market.
| Metric | Current |
|---|---|
| Active listings | 29 |
| Median asking price | $1.4M |
| Average days on market | 54 |
| Months of inventory | 2.5 mo |
| Sales in October 2026 | 13 |
| Sale-to-list ratio | 97% |
| YoY median sold-price change | — |
Price trend
Median asking price against median sold price, by month.
What actually sold
13 detached homes sold in Brant, Burlington in October 2026 at a median of $1.2M. Sales closed at an average of 97% of asking price.
Closed sales — the figures above describe homes still on the market.
$1.2M
The middle sold price among closed sales this period -- half sold for more, half for less.
$751
Median sold price divided by square footage, for comparing across different unit sizes.
2.5 mo
How long it would take to sell all current listings at the recent sales pace. Lower favors sellers, higher favors buyers.
0%
Homes sold this period as a share of new listings -- a higher ratio signals stronger demand.
97%
Average sold price as a percentage of asking price. Above 100% means homes are selling over asking.
13 sold in October 2026 · median $1.2M · 97% of asking
Aggregate estimates from TRREB MLS® data (PropTx feed). Deemed reliable but not guaranteed, and not an appraisal. Full terms.
Free monthly email
Get Brant sold prices by email each month
One email when the Brant market report updates. No account needed, and you can unsubscribe any time.
Buildings
Brant Condo Buildings
Explore condos for sale in Brant, Burlington. Browse building-level listings, pricing, amenities, suite sizes and market data for individual buildings in this neighbourhood.
Condo buildings in Brant, Burlington.
- 1441 Elgin Street Condos
- 824 Brant Street Condos
- Brant's Landing Condos
- Strata Condominiums
- The Ghent Collective Townhouses
- Harbourlights Condos
- Illumina Condominiums
- 2095 Prospect Street Condos
- 360 on the Pearl Condos
- Bridgewater Residences on the Lake
- Bunton's Wharf Condos
- Harbourview Residences
The guide
Living in Brant
Burlington, ON — downtown Burlington along Brant Street, steps from the waterfront and Spencer Smith Park
What kind of homes are for sale downtown?
Condos dominate, from 1970s-90s buildings such as Lake Winds and The Sands on North Shore Boulevard and The Palace and Grande Regency Condos on Maple Crossing Boulevard, to newer towers along Lakeshore Road, James Street and Martha Street by builders such as the Molinaro Group, Carriage Gate Homes and ADI. For a building-by-building guide to downtown condos, see Burlington condos for sale. The side streets hold older detached houses, some over a century old, and townhouses such as The Brownstones on Maple Avenue. Search houses with Burlington homes for sale.
What is it like to live downtown?
Downtown Burlington is the city's most walkable area. Brant Street and Lakeshore Road have restaurants, cafés and shops, Spencer Smith Park and the Brant Street Pier are on the waterfront, and festivals fill the park through the summer. Joseph Brant Hospital is at the west end of downtown. Burlington GO, on the Lakeshore West line with all-day service to Union Station, is at downtown's north end, and the QEW and Highway 403 are close. Schools come under the Halton District School Board and the Halton Catholic District School Board.
What should buyers check?
For condos, the age of the building drives most of the checks: older towers need a close read of the reserve fund study and status certificate, while new towers need a check of Tarion warranty dates and first-year budgets. Downtown is also growing, with several tall towers approved or proposed, so check what's planned near any building you're considering, since new construction can affect views and noise. For older houses, some may be listed on the City's heritage register.
Downtown compared, and prices
Roseland, to the east, offers large-lot houses near the lake. Uptown and Appleby have newer or more suburban condos. The Brant market report covers every property type, and the downtown condo report focuses on apartments. Our home evaluation helps sellers price with recent sales.
School catchments, programs and transit schedules change — verify them for Brant before you buy.
Brant Real Estate FAQ
What is the Brant neighbourhood in Burlington?
It is downtown Burlington: the streets around Brant Street from the lake up to Burlington GO, including Spencer Smith Park and the Brant Street Pier.
What kind of homes are in downtown Burlington?
Mostly condo apartments, from 1970s-90s buildings to new towers, with older detached houses and townhouses on side streets.
Is downtown Burlington walkable?
Yes. Brant Street, Lakeshore Road, the waterfront and Spencer Smith Park are all within walking distance of most downtown homes.
Is Burlington GO downtown?
Burlington GO is at the north end of downtown, on the Lakeshore West line with all-day service to Union Station.
How much do downtown Burlington condos cost?
It depends on building age, view and size. The Brant market reports on this site show current sold prices.

Miko Nalepa
Realtor® at The Condo Bar Real Estate · RECO #4737024
With 15+ years in real estate and a GTA West focus since 2016, Miko Nalepa is a Realtor® with Right At Home Realty, Brokerage, specializing in condos, townhouses, and detached homes across Mississauga, Oakville, Burlington, and Milton. The focus stays deliberately narrow -- four cities, not a Toronto-wide practice -- because that's what it takes to know individual buildings and blocks, not just neighbourhood names.
Miko Nalepa is also the creator of The Condo Bar, the data platform behind this site, tracking building-level sales history and live market reports across 450+ GTA West condo buildings so every recommendation starts with what comparable units actually closed for, not asking price.